015 #expedition

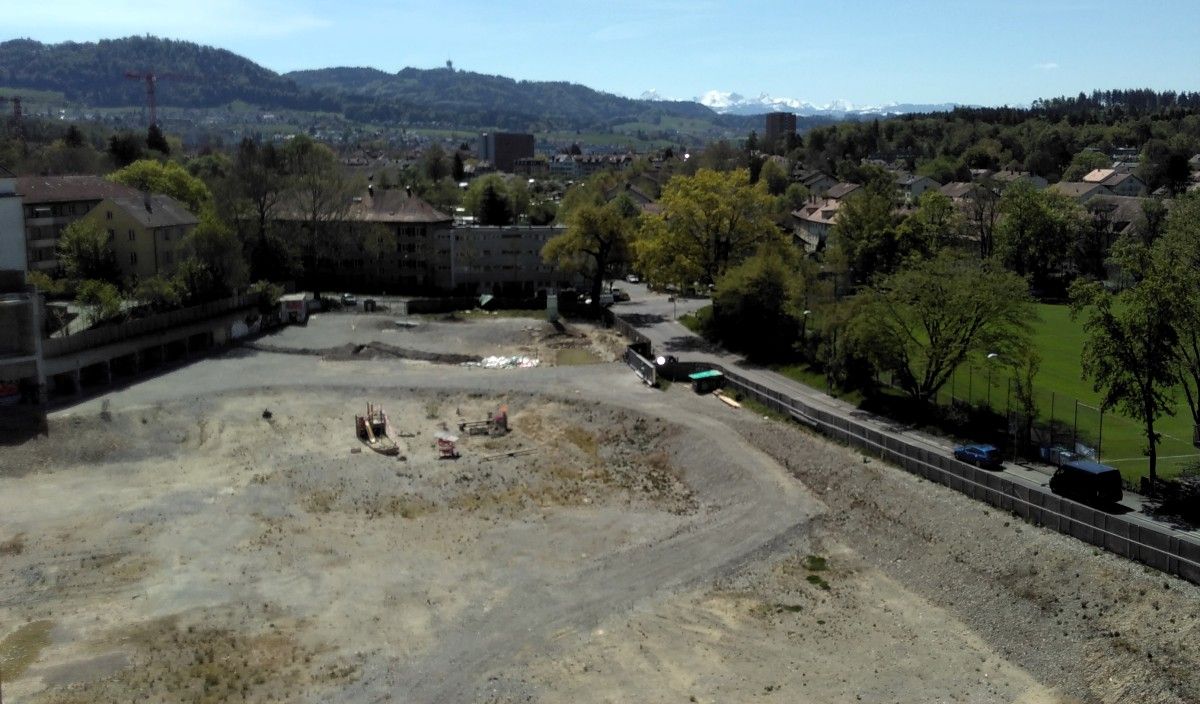
At the beginning of May we got together for a two day Data Expedition, a meetup about exploring data sources, learning skills and starting projects as a group, along the guidelines proposed by the School of Data. We did this at Warmbächli, a community redevelopment project to transform an old waste treatment plant into living space for at least one hundred families and dozens of small businesses in the western part of Bern, Switzerland.
Update: following up on the ideas in this workshop we ran an open air survey at the beginning of June, about which we report here.
The Expedition was led by our new members Florian Wieser, representing us next week at the School of Data Summer Camp, and Martina Kammermann, journalist in residence at Warmbächli with ambitions in #DDJ. Thanks to the operations team, especially Marco Steinacher, we were able to work, cook, and even set up a small exhibition of data projects in the Warmbächli Zwischennutzung ("interim use", as the current state of the project is defined).
We began by exploring potential topics of interest, from urban development to culture funding and Aare data (information of special interest to residents and visitors of Bern, through which the Aare river flows). Categorizing subjects in terms of breadth (of popular interest) and depth (of technical interest), we talked about how Data Expeditions could be relevant to people in our neighbourhood, while maintaining a wide-angle lens on how our experience can translate on a more global level through our interactions with the School of Data.
Urban data
The land around the site and part of the building where we worked are currently in an interim status, managed by a public association working on proposals in sustainable development. Information on this project can be found (in German) on their website and articles in Der Bund and BernerZeitung, as well as plans outlined about sportive, cultural and urban gardening activities being done by locals in the meantime.
This kind of interaction between a group of people, and the neighbourhood and city are a fascinating vantage point not only into the way the city develops, but also into the many different perspectives on interpersonal cooperation, new business and culture being brought into the mix. We thought it would be a great topic to study the data landscape around Warmbächli not just for our Expedition, but over the course of the summer as their plans take shape. At some point we could add something to the discussions taking place, giving more purpose to the study.
After writing out our Advanced Data & Dragons Character Sheets, we focused on investigating urban data about Holligen, the part of Bern in which the Warmbächli project is based. Dividing tasks along three sub-themes (demographics, gastronomy, housing), we used Internet searches to collect open data about the neighbourhood, and used Libre Office (with this helpful Pivot Tables blog), Python (using Jupyter) and Tabula to make sense of the numbers.
Demographics
The Wikipedia page about the neighbourhood has the basic information to get started - coordinates, population, zip code and BFS (Federal office of Statistics) numbers. It doesn't go into much detail: only one sentence of historical reference and a screenful of text, mostly talking about the sports club and transport connections. There is a lot more background information on Holligen.ch, the official website run by residents associations, which have sub-sites full of historical information and more. Still, this web site is quite static and, apart from upcoming events does little to inform the visitor on day-to-day activities. Much more of this spills out across Facebook pages and hairdresser waiting rooms.
Basic demographics on all parts of Bern is maintained on a dedicated Wikipedia page. To go further does not require a social science degree - though, as a social mixing study (Journal B) published last year suggests, proper long-term research into diversity, conflict management, and the structure of 'normal society' is essential to maintaining sensible urban development policy. Some more in-depth analysis can be found in an earlier Gentrification study.
From such numbers, we were able to say that:
- Holligen is the 4th largest neighbourhood (Quartier) of Bern
- .. with the 4th most residents of all neighbourhoods
- .. the 3rd most foreign residents of all (32%)
- .. but is only 26th in terms of urban density (18 residents/ha)
The last point in particular (that Holliwood is the 8th least dense neighbourhood in town) makes it apparent why it is one of the main growth prospects of Bern and the focus of many urban development projects. More numbers to be crunched in Demographie.ods
Geography
One issue we quickly encountered was to determine the actual shape and size of the neighbourhood. Looking through online reports we noticed that Holligen was either very large or very small. It became clear that differentiating these areas would be critical to be able to make any comparative analysis. Same name, different contours - which Holligen are we talking about?
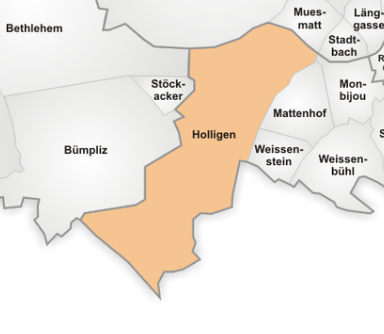
Source: Wikipedia
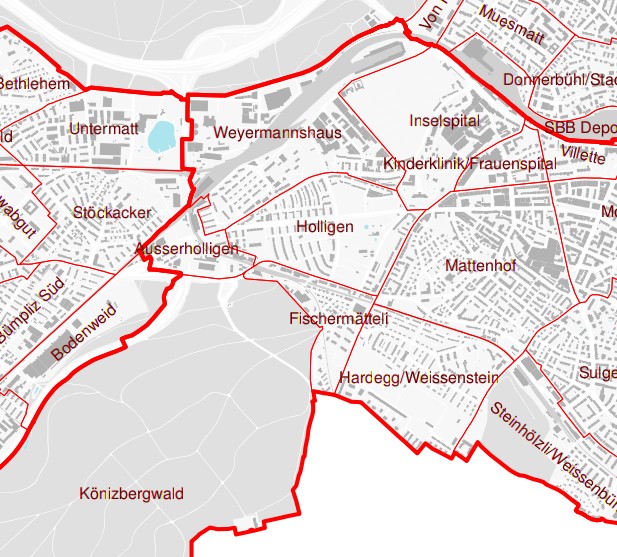
Source: Bern City Statistical Office
We decided to focus on the larger city-part, at least since more statistical data would be available. Indeed, the National Statistics Office has all kinds of data about neighbourhoods around the country. The approximate shape was downloaded from Mys Quartier, a previous Open Data project where we converted Bern's neighbourhoods to KML format. With this shape file in hand, we were able to zoom into various reference data using the national geodata portal, here overlaid with the boundaries of the post code:
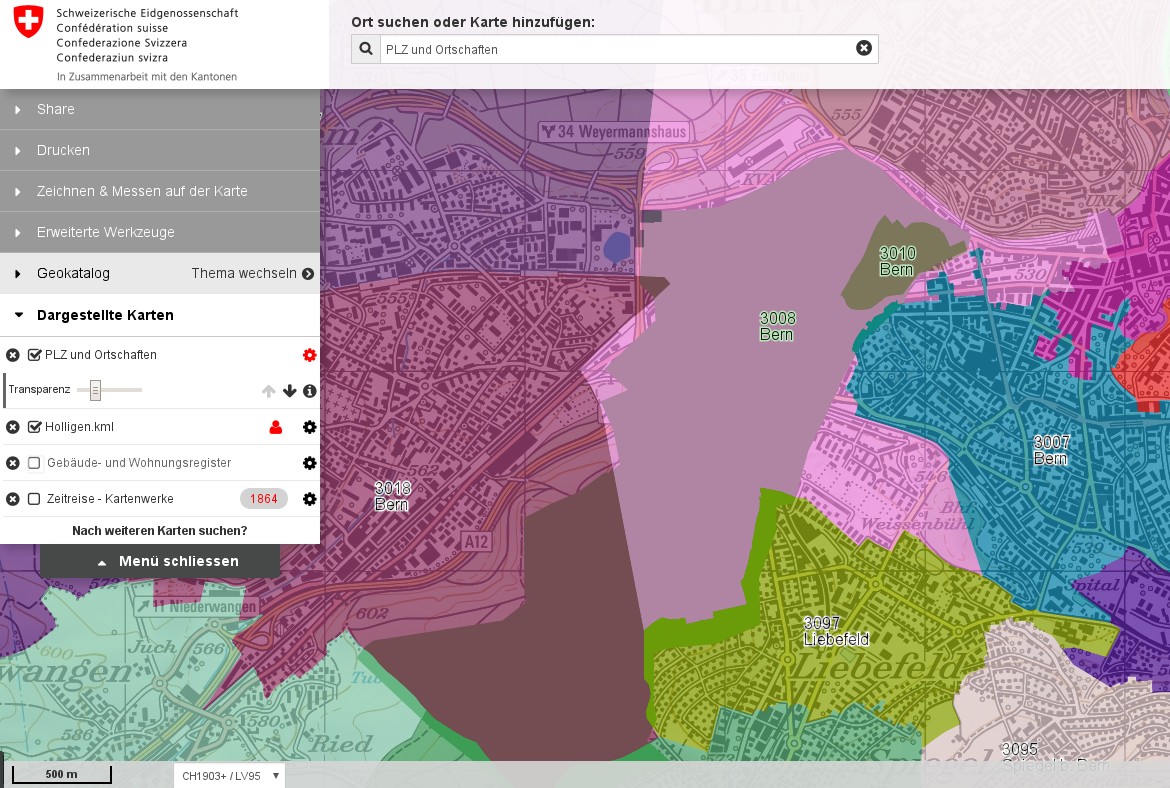
^ Explore this visualization interactively at https://s.geo.admin.ch/6bacf85288
Gastronomy
We learned that there is an enormous amount of data available on the surface of various census projects, sometimes accessible through web sites, other times in layers of documentation. Yet to find out what really is going on, one has to dig deep - and often find indirect routes, like the Stadtsgeflüster project which crowdsourced 'secret tips' from Swiss city residents.
Some information is very open - like the public directory of shops and services maintained on the official residents website. Some open information is less accessible, like the Company Register which does not allow restricting searches to a geographical area like Holligen. So we used a time-tested approach to find out where people go to eat: the phone book. Meticulously copy and pasting from a bunch of Internet searches - as well as racking our brains to include any places we knew should be there but were not necessarily on a map, we came up with a relatively complete list. Regular expressions and Python wrangling were used to format the data, which you can download here: gastronomie-holligen-pivot.csv
Rents
For most residents, most of the cost of living in the area will be in rent[citation needed]. Recent news articles claimed rental rate hikes (BernerOberlaender.ch), but official data was not so easy to come by, Bern lacking the in-depth open government data sources like Basel or Zürich.
National Statistics for the latest available period of 2000-2014 suggest hardly any rise of the average cost of rental in Bern, and corrected with the national price index even a slight decline (graphing this is something we didn't get to yet). Running a few real-estate searches comes up with very few possibilities, especially on a low-medium budget (e.g. ImmoScout24, Homegate, Comparis).
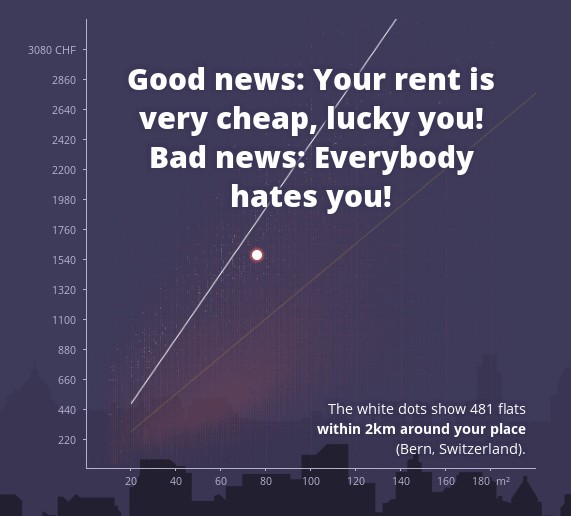
As an alternative to all this, we came across a great Europe-wide crowdsourcing project called RentsWatch, started by Journalism++. The site asks people to fill in a short anonymous form with their location and cost of living. You then get a report of how your numbers compare to the local trends, complete with snarky machine-generated comments - something like this:
This data has been statistically analysed for larger cities including Zürich to paint a bigger picture:
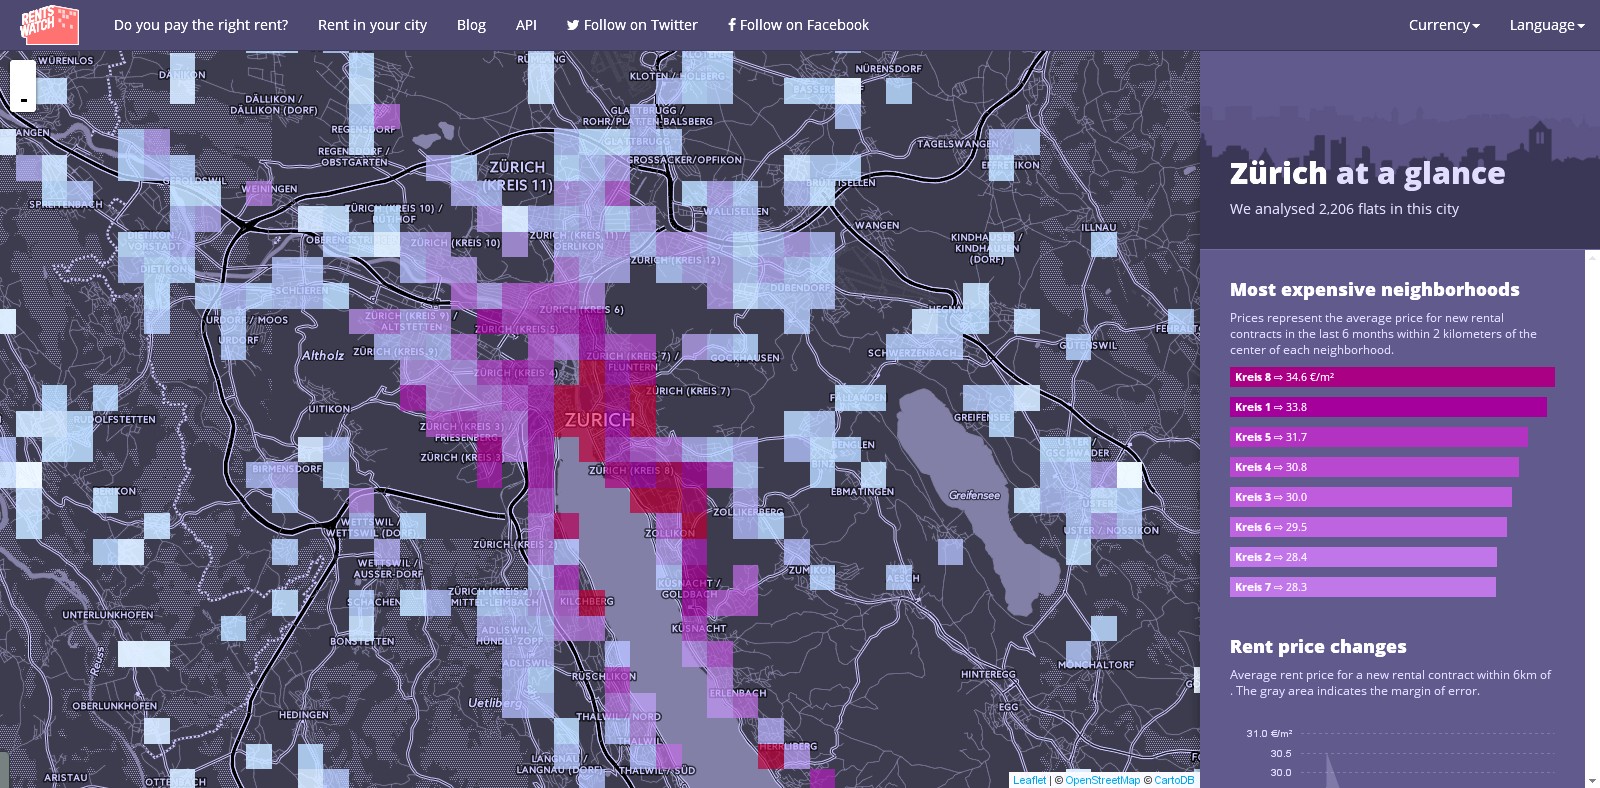
..and is available via API for others who wish to repeat the exercise. Something that was recently done by RTS.ch in French-speaking and TagesAnzeiger in German-speaking Switzerland.
We briefly started exploring the API as well, and brainstormed some interesting ways we could put it to use in future expeditions.
Next steps
While we didn't manage to get to the 'summit', our Data Expedition at Warmbächli gave us a taste for what's around the corner. We would like to work with more (accessible and fresh!) demographics data and find out what's really ticking as neighbourhoods grow and transform around us, making the data in turn more accessible to people who want to take part in urban development projects. Connecting statistics to human activities like the 'food data' or housing surveys we have been looking at makes the data potentially more relevant and impactful.
Our next steps are to propose a project along the lines of what we did in this Data Expedition to the Brache.ch group, which is collecting ideas for uses for the site. We would like to talk to the working groups of the association about their actual needs, and find out what gaps they feel exist in the data. Further Data Expeditions can go along the lines of what we did here, as regular opportunities for skill sharing and reference building.
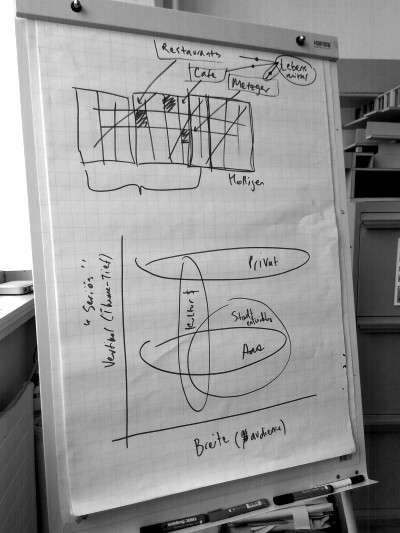
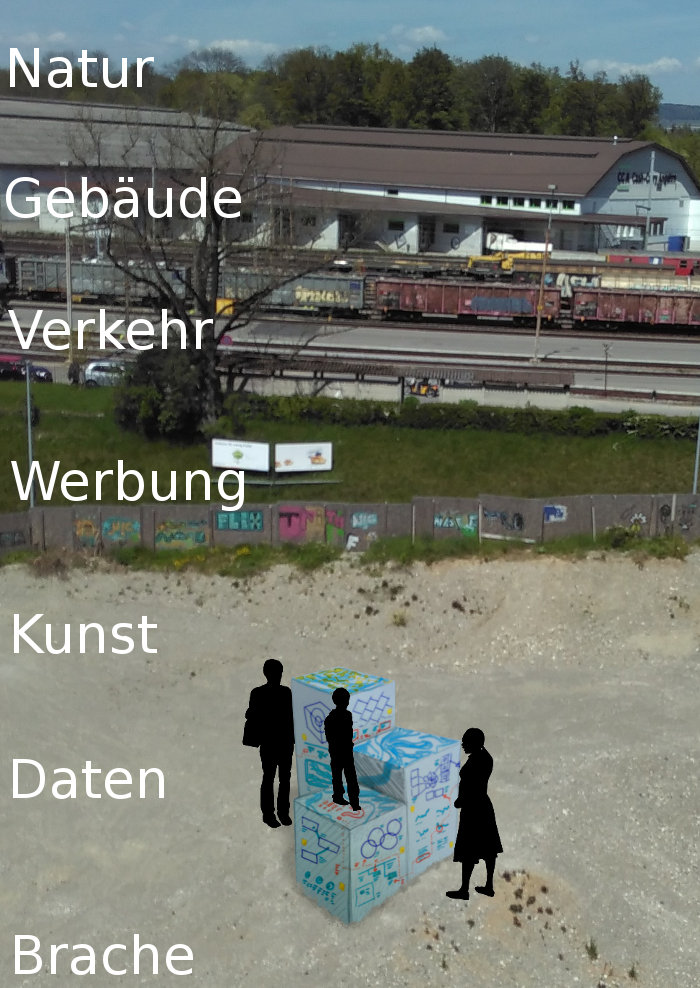
As a possible creative output, we are thinking of putting up several large boxes in the old landfill area, along the faces of which graphics and texts will visualise information relevant to current and future residents of the neighborhood, and which will also collect 'analogue' data along the lines of the Visualization about Sufficiency by our friends at YAAY.ch. The data connects present day concerns with established facts, communicated in a way that, rather than dispelling doubt, invites further questioning. A quick sketch of the basic idea:
Many thanks to Martina & Florian for their efforts in setting up and running this first Data Expedition at Warmbächli. If you would like to join the next one, sign up to our mailing list (low traffic) or discussion forum (high traffic) and stay tuned!
NB: following up on the ideas in this workshop we ran an open air survey at the beginning of June, about which we report later in this blog.
