076 #activitywatch
Visualising my quantified computing while ruminating on the state of data culture.

I have logged 870 hours on my work laptop in the past half year. Here is how my profile of AFK time (Away From Keyboard, in a meeting or on a break, a.k.a. "compiling!") vs Working time (typing, mousing, slacking) looks like. In total the numbers represent about 100 workdays. You can see in the graph that Tuesday afternoons are my regular parenting time, compensated by the hours I put in on Saturdays. Read on to see how and why this was made.
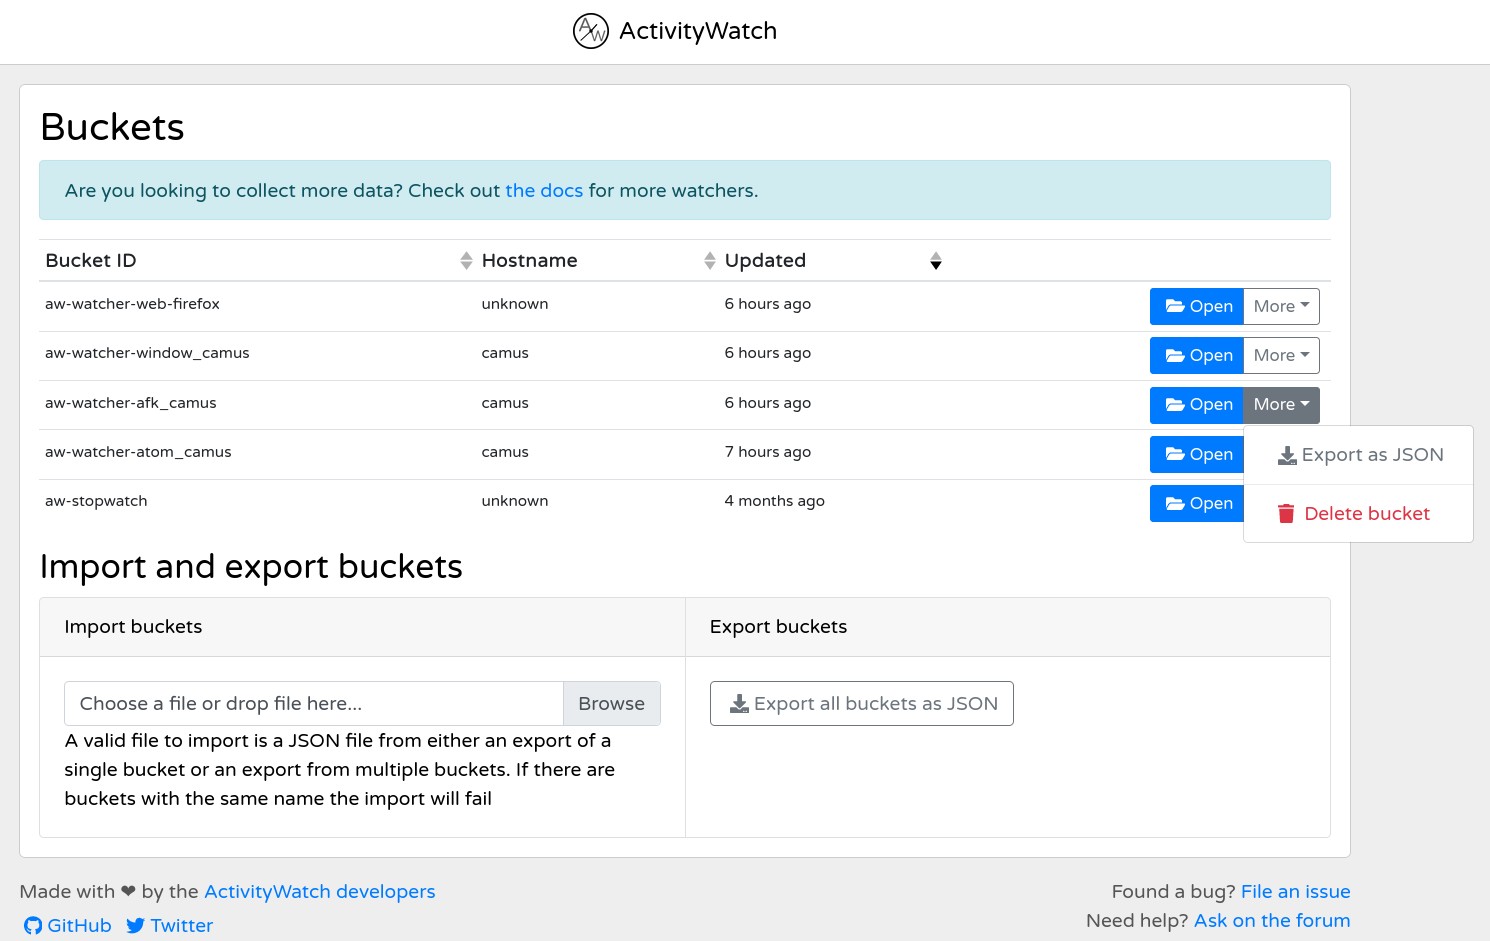
The data was collected using ActivityWatch, an open source self-tracking tool which I've enthusiastically left running on one of my laptops (running Fedora Core 34 Linux) and to a more limited extent my Android phone, since the spring. There's a pretty good introduction to it here:
While getting the dashboards and reports up and running is more involving, for this kind of data there was very little set up necessary. Just hit the Export button on the Raw Data screen next to the watcher-afk bucket.
You'll get a JSON file which is neatly formatted, but not particularly parseable in visualisation tools, unless you want to jump straight into a JavaScript or Python console. I therefore suggest first converting it to CSV using a console tool or a Web app like https://konklone.io/json/
Then open it up and massage it using your favorite spreadsheet or data wrangling tool. I just split the afk/non-afk values into separate columns and added a Weekday column using LibreOffice's formula:
=TEXT(A2;"NN")
Then I grouped and summed up the individual values by weekday, excluding very long breaks which were probably due to tracking bugs, and converting from seconds to hours, using:
=SUMIFS(B:B;D:D;"Mo";B:B;"<36000")/3600
Finally I pasted the result into Datawrapper to make a neat embeddable little chart. Please let me know if you have any questions, and support the ActivityWatch project via OpenCollective or GitHub.
I am a freelance developer, and the open source project ActivityWatch makes self-tracking and reporting easier while keeping it private (= offline). Consider supporting them too — every little helps! https://t.co/L1VfgxYLzg via @opencollect @dribdat
— Oleg Lⓐvrovsky (@loleg) March 3, 2021
Or, if you prefer to stay more on the analogue side of life, you could always use LEGO!
Image from https://scrumburg.wordpress.com/2013/04/05/stein-fur-stein-zur-besseren-zeiterfassung/
Wait, but why?
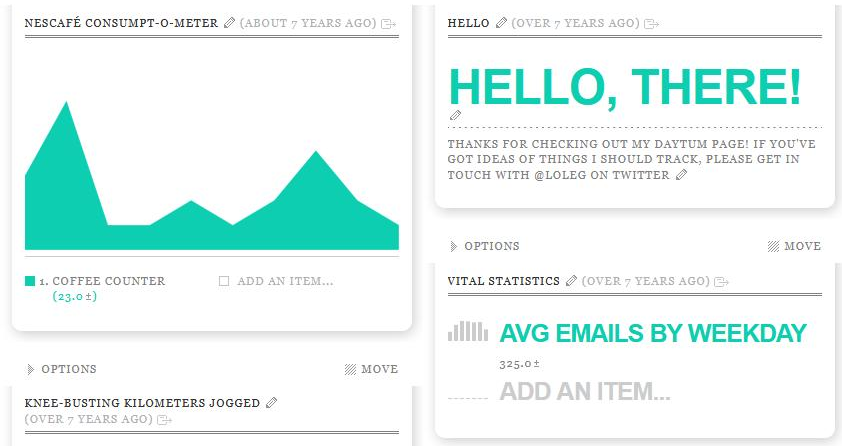
Early this year I took the radical imperfection in time-tracking course at the School of Making, Machines and Make-believe led by intrepid quantified selfer @xn_ze_ro, inspiring me to take a fresh look at my habits and patterns. A decade before this course, I was already an admirer of the Quantified Self movement, following and using some of the tools of Nicholas Felton to make my coffee consumption and jogging streaks into ethereal little pieces of data poetry.
Since then, this was dampened by a growing awareness of the risks involved in the use of commercial tracking applications, the rampant abuse of our digital histories and online fingerprints, and most recently last year's encroaching of civil liberties in response to the pandemic. The soda.camp project documented on this blog was a step towards reconciling some of these questions in group settings, bringing data storytelling and literacy into focus.
From the many Hackdays and Data Cafés of Opendata.ch to courses and workshops in data wrangling around the country, there is a lot of local interest to keep me busy. Around the world, at places like the schoolofma, the artists and pioneers are squashing the digital-analog divide, inspiring us to seek a more inclusive, generous and humane vision of data culture. In short, while we are individually shaken, collectively great strides are being taken in this new, more intelligible and purposeful emerging data culture.
So it was my great privilege to be able to participate in the course this spring. We learned about and tried a variety of self-tracking instruments, some more wistful than others. You can see some of my contributions in the April '21 Zine (PDF, 12 MB). I used the ActivityWatch data to also produce this limited-edition NFT, because that's what the cool kids are doing:
Taking a second look at how we spend and value time both emboldens me in my practice and relationships, as well as an important area of discussion and competence-building at collaborative events and the tools that make them tick. It is also something (I hear) the surrounding country is rather well known for. So what data whispers are you tracking? Where or when to go from here? Let me know :)

CC BY-SA 3.0 Paebi - Wikimedia Commons
