004 #research
The past weeks were busy for all of us involved with the Open Research Hackdays, initiated by a consortium of Swiss academic institutions and organized by Opendata.ch. From the hackdays, we hoped to learn a bit more about what issues people working in science (and those supporting them) have with using and publishing data openly, what questions if any they have, to learn something of their experience and start joint projects. We livestreamed a Data Ethics panel, and ran two So/Da workshops.
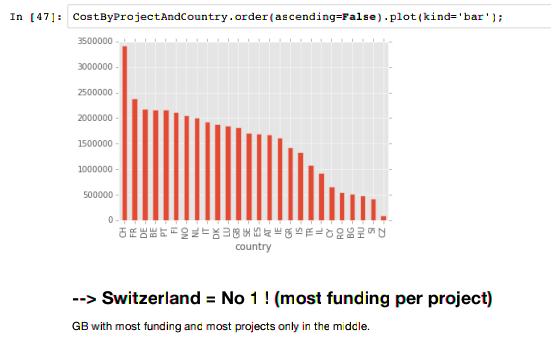
On Saturday, we had a call between Lausanne and Zürich, taking turns sharing our hackathon projects. One that particularly stood out in the context of our workshop was Analyze CORDIS data, which looked at EU research funding. Their presentation in the form of an iPython notebook (PDF) was articulate, the data capably analysed, the message revelatory. Great storytelling and data wrangling.
Read on for more details of our workshops.
Cleaning, refining, and transforming data without coding
Julius Chrobak (@julochrobak) prepared and ran the following presentation in Zürich, an "introductory workshop to crucial tools in the field, from a practitioner’s point of view":
-
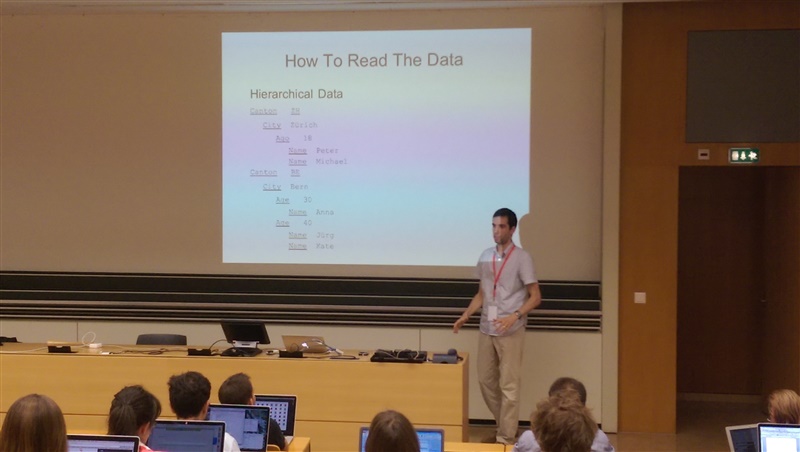
Reading the data
Shared a couple of slides and examples about tabular data and hierarchical data. Explaining why we have them, some pros/cons. Covered in couple of sentences the various formats Excel, CSV, HTML, JSON, XML, as well as high level introduction to file encoding, i.e. why do we see in files sometimes "Zürich" and sometimes "Zürich" -
Transforming
Tables in HTML WEB pages into CSV using convertcsv.com. Hierarchical (JSON) into tabular (Open Refine). Converting values by specifying a reference example of the desired output (transformy.io). -
Clean up (Open Refine)
Manual editing of single/bulk cell values. Functional editing (writing transformation functions). Merging clusters based on similar values. A quick intro to the Reconciliation functionality.
This took roughly 30-40 minutes, and there were a few questions, including:
- is there a tool which takes a text file and recognizes that there are multiple CSV tables with different columns and automatically extracts those tables into separate CSV files?
CSV files are supposed to contain only one table at a time. Nevertheless such a tool would be straightforward to make if the tables are clearly delimeted. Also have a look at Tabular Data Packages and Good Tables for good ways of publishing and working with CSV files.
- what is the performance/input size limitations of Open Refine?
There are no specific limitations, the software can be tweaked to fit your hardware capabilities - see Open Refine FAQ and Architecture notes. Nevertheless, if your data is in the hundreds of megabytes or larger, you should consider creating an extract for analysis using tools such as Hadoop.
- is there RDF support in Open Refine?
Yes, using the DERI extension you can connect to RDF data sources.
- what do we aim to teach and to whom at So/Da?
Great question! This blog and site aims to answer that with steadily increasing clarity; for a longer discussion see our concept paper - if still not clear, please reach out.
Kind thanks to Julius and his supportive audience!
Exploring and referencing (social) science data
Meanwhile, in Lausanne we also had a group of people who chose to take part in a hands-on workshop. We did a quick introduction to the School of Data and how it fits into Open Knowledge, and also talked about the more science-focussed Software Carpentry initiative and its cousin Data Carpentry who are running workshops like this one (NB: no LICENSE and website is copyright!) in other countries.
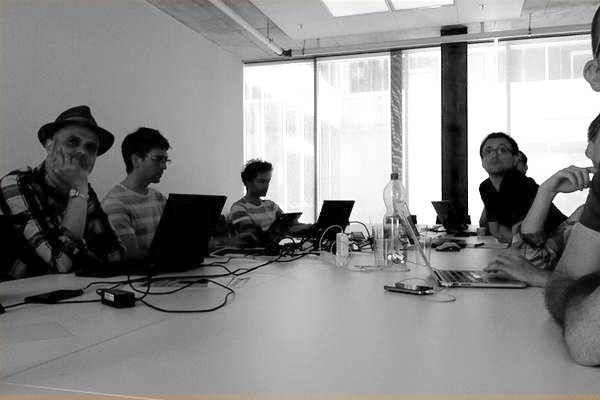
Our participants opened up an Etherpad and shared what they all want to learn. We then dived into:
(1) Learning how to cross-reference datasets
In other words, how to find the most convenient and durable way to publish your data, and MAKE SURE PEOPLE CAN FIND IT! We looked at DataCite and Github for Data (with upcoming large file storage), Nature's interactive demo, explained iPython/Jupyter, SciPy and Anaconda, and seemed to come to agreement that datasets and their analysis are best kept in close quarters.
(2) Cleaning up messy data in an easy and fast way ;-)
While everyone agreed this was an area of no quick wins, we wanted to practice our data cleaning skills together and learning something about the social science dataset we got access to from our hosts FORS Centre, without compromising its anonymity.
We looked at it in its CSV form, that is, without any defined statistical models or even supplemental metadata (the server was crashed and we could not access any documentation, not what you would usually expect in science, but a pretty common scenario for the odd dataset floating on the World Wide Web) - then came up with a simple challenge: how do we know which is male or female in the gender column of 1's and 2's? Our ideas were to look at the:
- Grammar - lexical analysis of conjugations in the text
- Demographics - life expectancy, additional statistics
- Statistics - distribution of ages
Learning something from the textual responses using vocabulary analysis was then a stretch goal. We opened up a shared instance of Open Refine and went through the paces of isolating columns, excluding blanks - and counting them for simple tests, faceting and filtering and pivoting the data, finally creating a histogram of most common words which could be used for comparison, dipped into GREL and Jython for custom facets, and the templated export feature for getting started with visualisation.
(3) D3/data visualisation basics
While we talked about D3.js and it's rich library of examples before, we all wanted to look more closely at Bokeh, which is a relatively new tool that can be used to render D3 within an iPython notebook. We tried to get their interactive point selection example to work with our data, and ran one or two exercises before it was time to wrap up.
The main takeaways from our session in Lausanne were:
- know the data you will talk about well;
- prepare a path through the tools, but, as much as possible, let participants discover it for themselves;
- set small attainable goals to keep up the motivation :)
Again, thank you to our participants and to FORS for hosting and sharing their IRL expertise and samples. We learned a LOT!
Coding up next
- A great reason to visit Basel is the Poetics and Politics of Data exhibition that just launched at the new House of Electronic Arts museum. Lots of inspiring work by international artists that combine technical ingenuity with extraordinary talent, courage and humour. I went to check it out at the launch, met a couple of the artists, and came away inspired. Don't miss it!
- Young Rewired State is still actively encouraging us to participate in this year's Festival of Code. We need to make up our minds and get set for the summer.
- Thank you to the So/Da team for the valuable feedback to the concept shared here. We will continue to work on this and hope to nail down a vision and concrete plan for this initiative as soon as possible.

Luc's sketch of Open Food DNA visualisation, one of the several projects started at the hackathon this weekend.
