056 #criterion
We represented civic tech and open data at one of Switzerland's top trade fairs dedicated to sustainability. Here's how.

This year the association Opendata.ch presented at Criterion: a four day festival at Messe Zürich dedicated to sustainable design and business. We partnered with Crowd Container to highlight some of the ways in which Open Data could play a role in enabling and monitoring sustainability. In addition to our adjacent booths in the Smart Transparency zone of the fair, we held a joint panel session moderated by Impact Hub Zürich, coached startups, and even virtually contributed to an open product footprint hackathon.

Like what you see here? Save the date and join us for the Opendata.ch/2019 Forum in Bern on July 4 to discuss ideas with sustainable impact!
Our team is behind Smart Use, a Civic Urbanism project putting open data to use in participative city planning. More about this topic can be found in earlier coverage of AMLD 2019 on this blog.
We co-presented with BitsAboutMe, a new Personal Data service that aims to help protect your privacy and get a fair deal when sharing profiles with companies and institutions. Throughout Criterion we engaged visitors in demonstrations and explanations of the boundaries and intersections of personal and public data.
Our booth also featured a digital showcase of projects from the open data community, including outputs from recent crowdsourcing events such Opendata.ch Hackdays that we felt would provoke critical responses from Criterion visitors. We were supported with this concept by Crowd Container, with whom we are trying to surface developments that involve consumer choice or topics of sustainable trade.
We have been brainstorming and keeping threads alive on these topics at least since the Opendata.ch/2016 Un/conference. There is a new wave of projects like BONSAI, a new global Open Source Database for product footprinting - whose organizers we met at the Energy Hackdays, and whose own first hackathon we virtually supported during Criterion week. There is much to learn about the reams of data powering the world's supply chains, and connecting this data belongs at the heart of our movement.
The role of #technology and #bigdata in transparent trade. Discussion at #Criterion festival with @OpendataCH and #Crowdcontainer. Moderated by @Descamp51894767 from @impacthubzurich pic.twitter.com/UZrlt5MSUb
— Impact Hub Zürich (@impacthubzurich) March 31, 2019
Visualizations and open data projects like the one mentioned below can be found online at db.opü.ch. Further in this blog post we will go behind the scenes of our civic tech installation.
Good reference to the ongoing "transparent trade & #bigdata" talk at #Crtierion. An example of how #opendata can be used and displayed: https://t.co/SR0O7S2T8S
— Impact Hub Zürich (@impacthubzurich) March 31, 2019
Tangible city
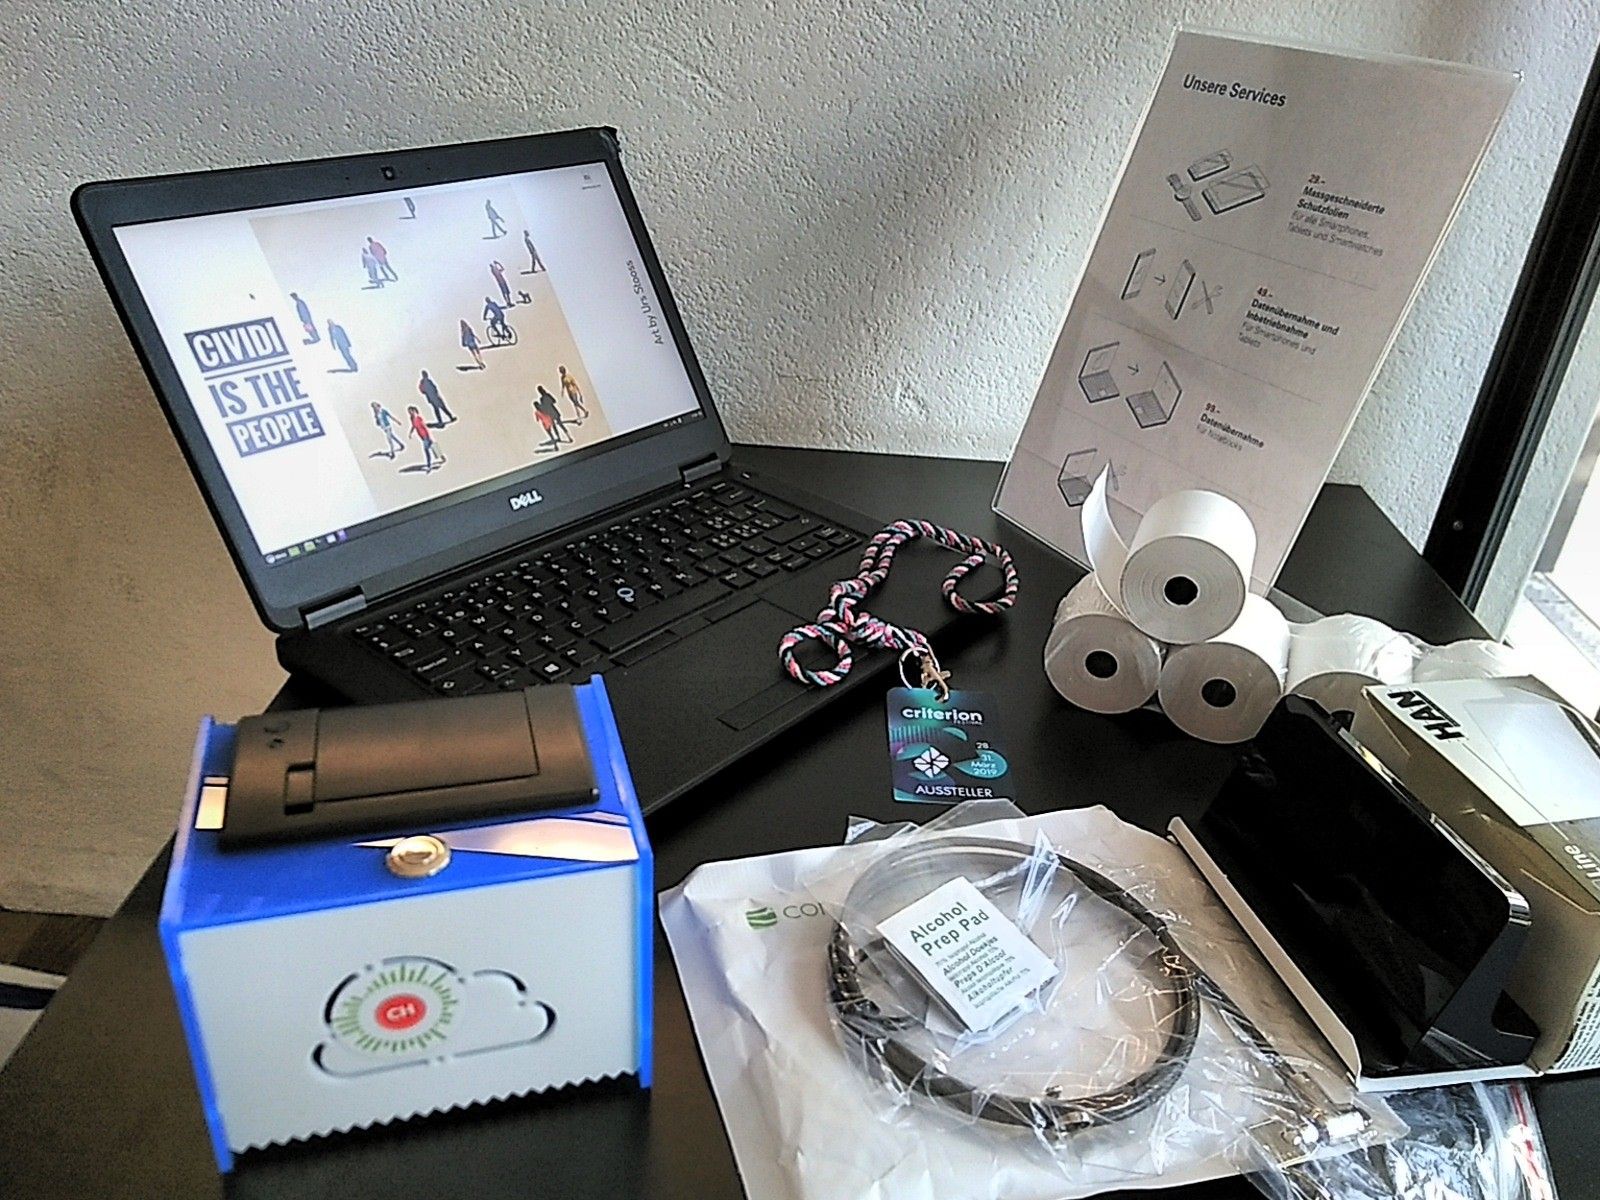
To make the most of our presence at Criterion, we wanted to put "things" into the hands of visitors that were tangible and even analogue, rather than digital - yet still produced with the kind of spatial analysis and awareness of urban questions that we are working on with the Smart Use team.
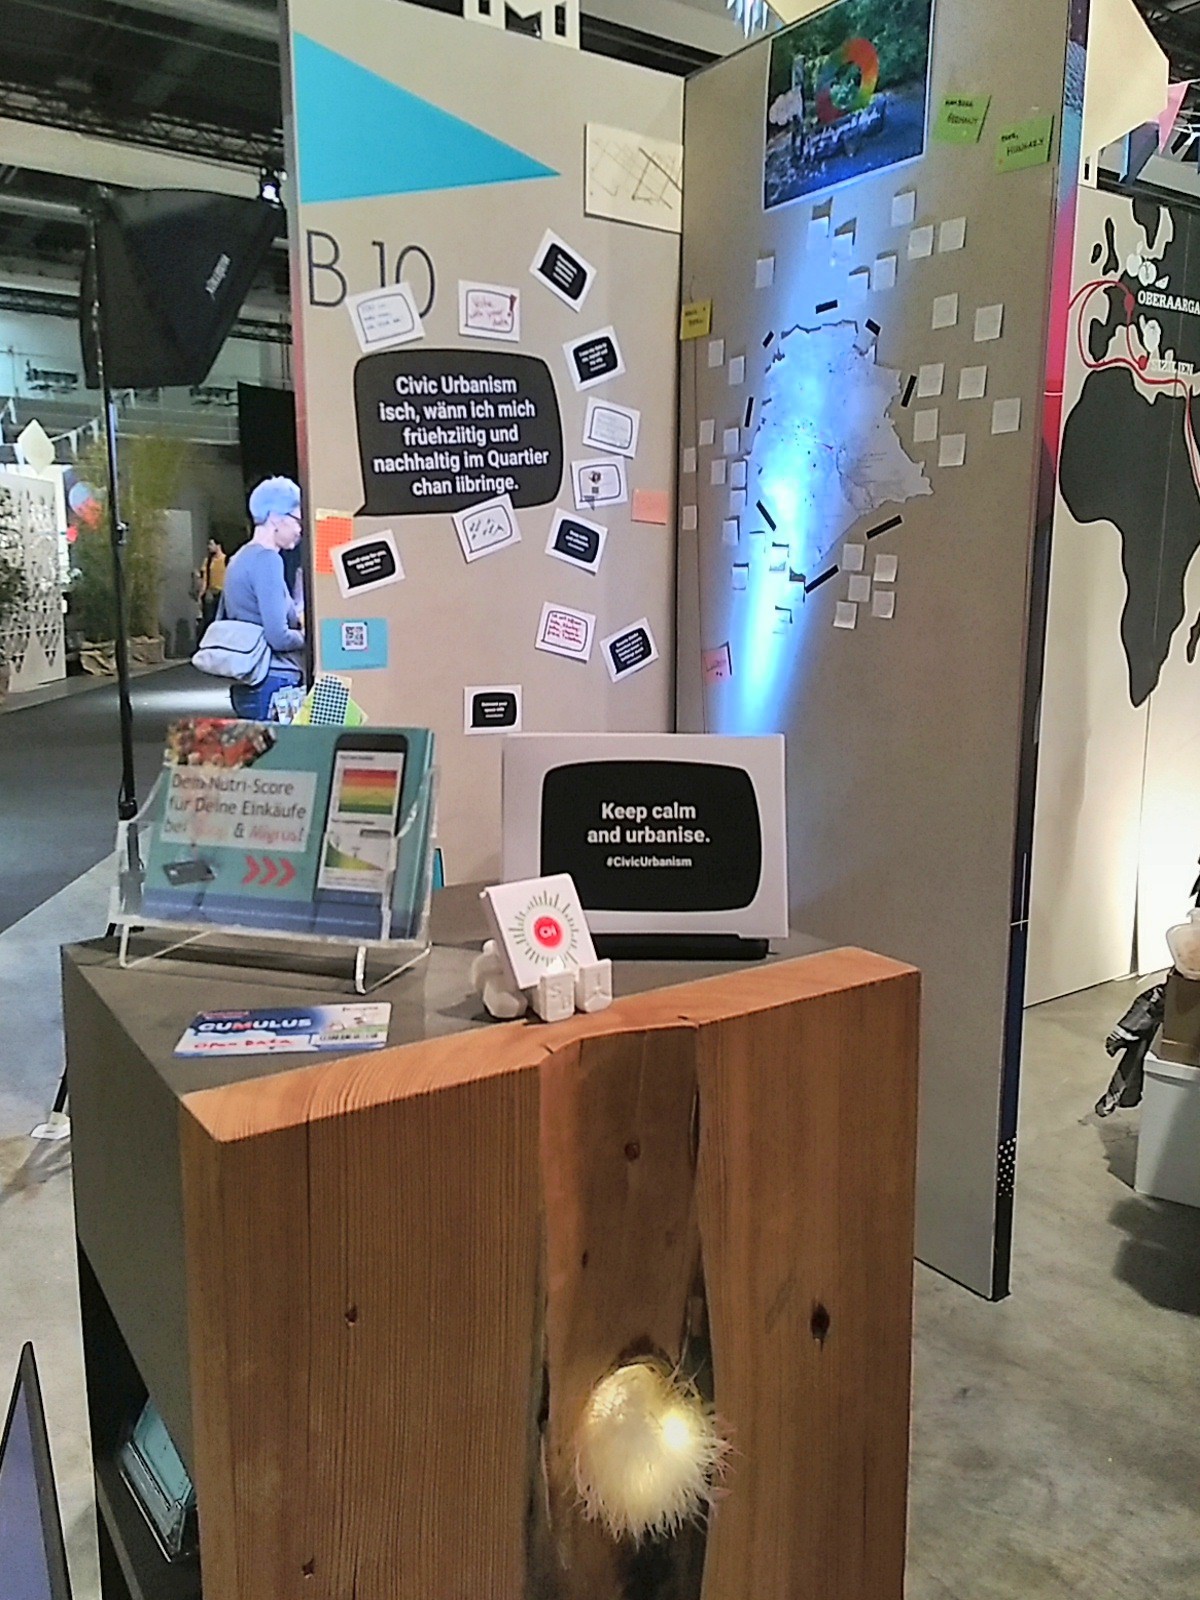
On the analogue side were cards on which visitors could write down urbanism challenges / questions / provocations, or use the companion website. Another was a map of the city as shown above, on which stickers were used in a similar way to the earlier data://transform.bz installation, to pin-point our visitor's geographical interests. We even had a totally analogue box of inscrutable chocolate eggs.
Arguably the cutest Thing we brought, was a "happy little printer". After considering everything from tabletop games and silk-screened fabrics, our initial plan was to use X-Y plotters and 3D printed charts. We experimented with an AxiDraw and Printrbot, both made available through the FabLabs of Bern and Zürich.
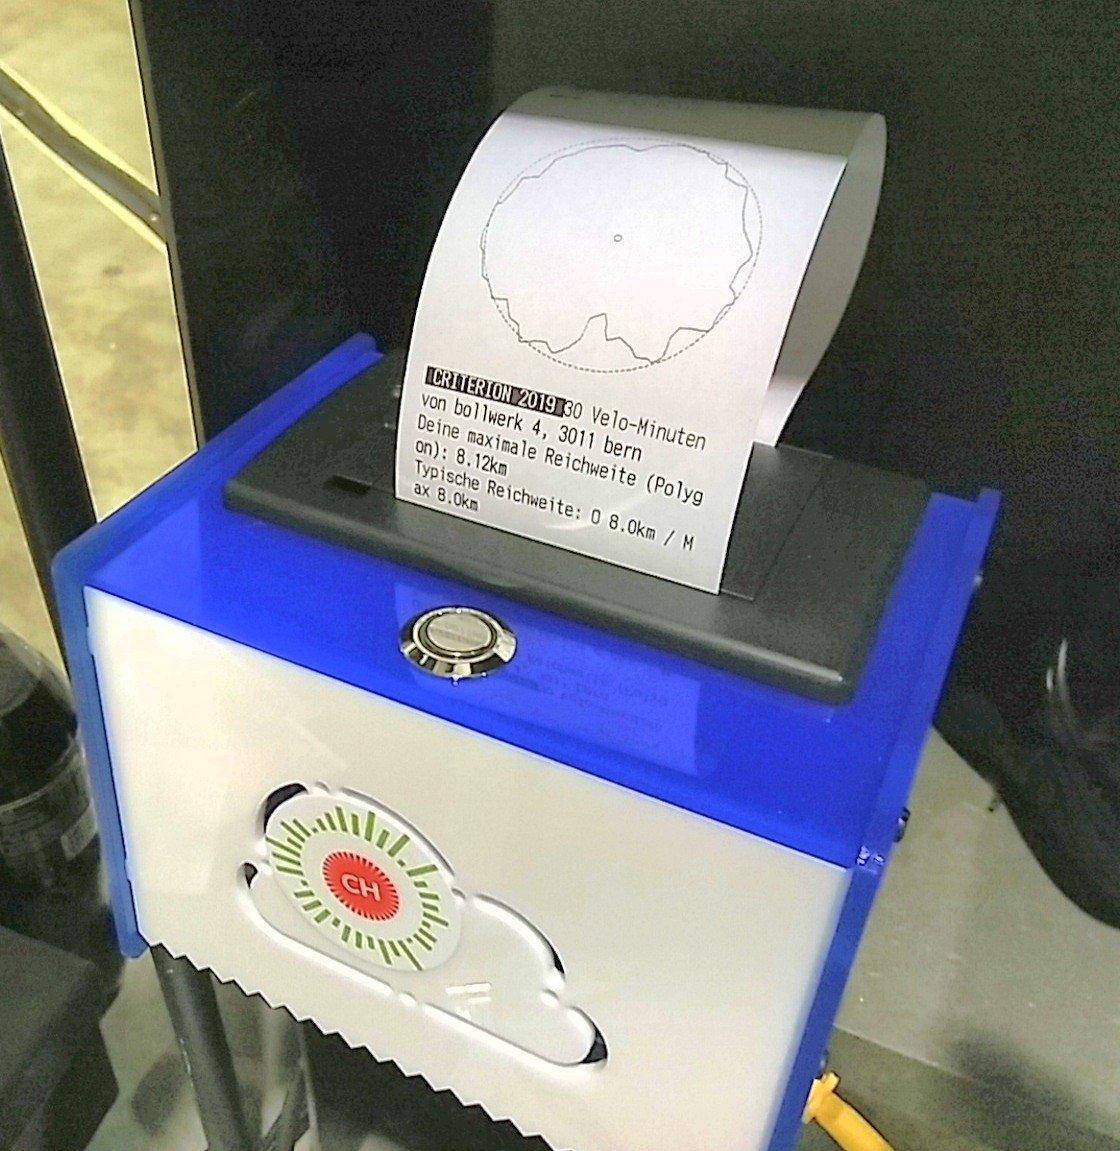
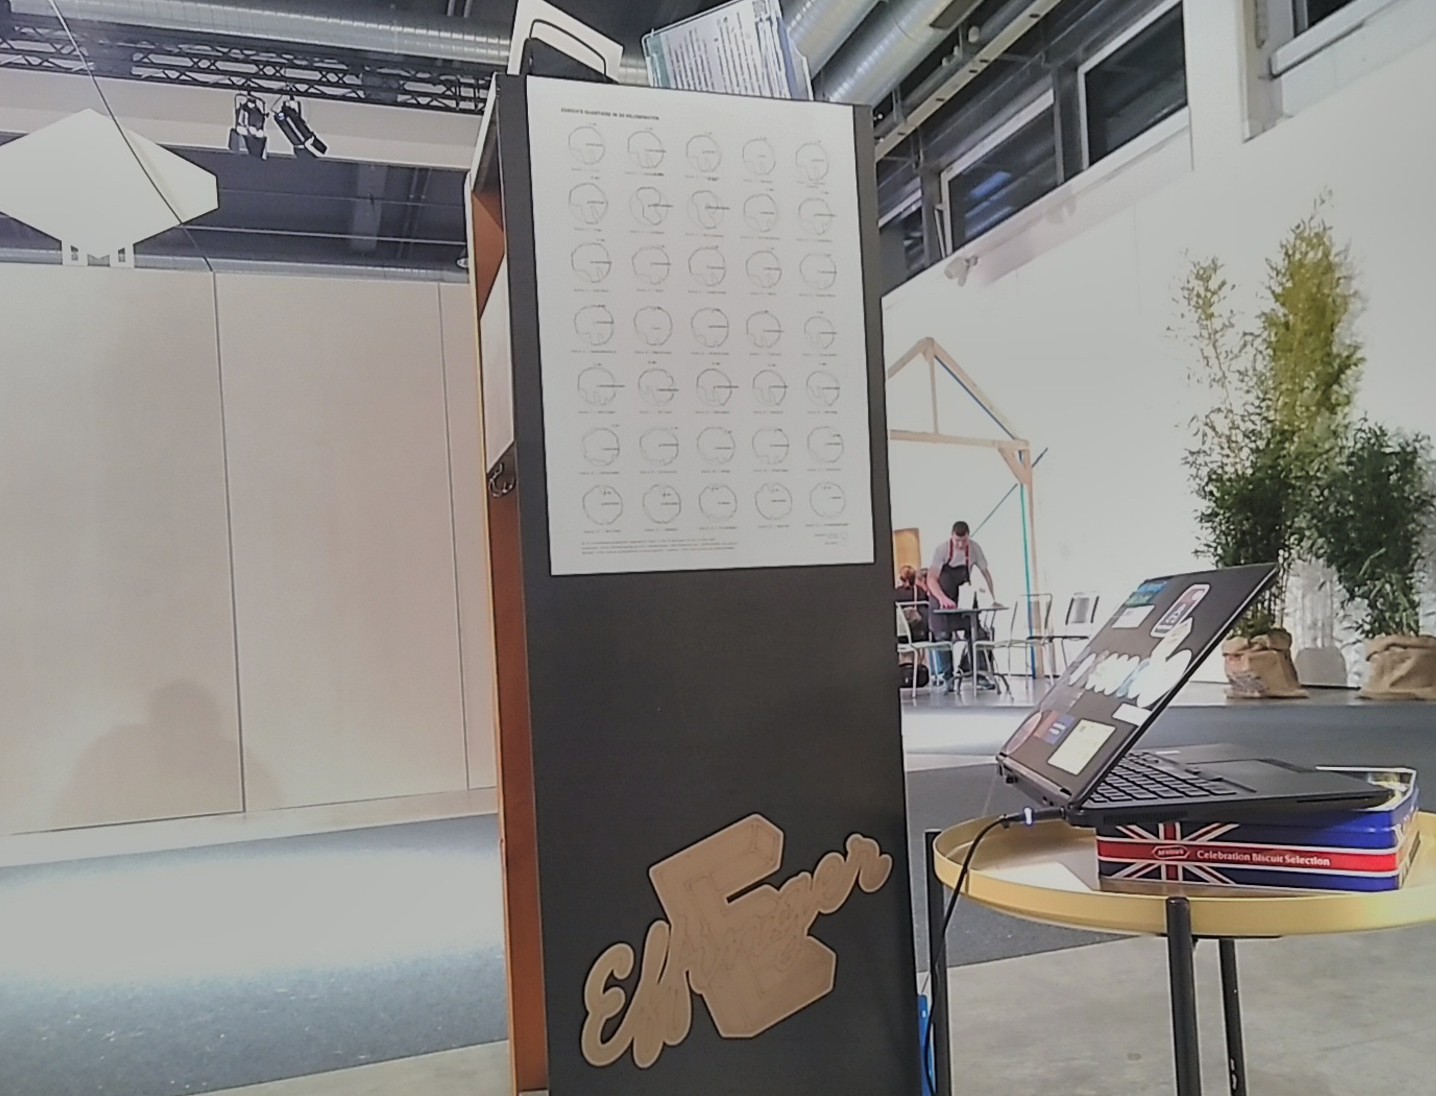
Finally, inspired by the Berg London and encouraged by fellow makers, we assembled a small printer connected to a web service, that generated text and imagery on demand based on geographic coordinates. Our open hardware based device generates receipts showing how well connected your home (or office, or organic fair trade shop, or any other location), is to the surrounding city by bicycle.
With this installation we wanted to point out the value of open source, open data and open hardware, and provide - in addition to Open Knowledge stickers and Fab Lab flyers - a simple memento that would hopefully keep people thinking about their urban situation. We stocked up on thermal rolls like any other Point of Sale operator (acknowledging that paper receipts are not sustainable and soon obsolete), happily producing personalized data viz for visitors of the fair.
Location, location
A personalized mapping algorithm creates diagrams or forecasts based on any given address input. A bike friendliness map shows you how well your location is connected to mobility in the region. By saving the resulting High Score (none of the addresses were kept), we could keep track of participation during the four days at the festival.
The design of our idea required a monochrome, receipt printer compatible output. Hence some kind of plot or image based system would be needed to then be converted into a bitmap for thermal printing. Traditional web mapping platforms would not provide the necessary tools - so we turned towards Python libraries for generating charts: pylab from matplotlib in particular. The initial development was done in a Jupyter Hub data science environment.
To get location based data for our visualization, we connected an API we've been using for quite a while in projects - OpenRouteService. Dedicated to routing and related computations like isochrones and distance matrices, it is based on Open Street Map data and topography. An awesome project leveraging open data to solve real world problems, OpenRouteService also offers a Python package that nicely integrates with GeoPandas and Shapely. With that in place, we started hooking up the address input from string to do a geocoding request, and receive the Latitude and Longitude for the address.
Next we calculate the 30-min bicycle Isochrones (a curve of equal travel time - see wiki.openstreetmap). Since we already have a Latitude and Longitude to supply, we just need to pick a bike profile and the range. After some testing we opted for the "cycling-regular" profile and a 30min range. The average speed for a cyclist being 15 km/h, 7.5km should be the usual distance for 30min. However, in most cases, we found that it is closer to 8 km for city bikers. Hence we added an 8 km circle for reference to the map. For additional spatial awareness, we tried adding the nearest train station as well as airport with small markers, pulled from a PostGIS database via geospatial query. However, we left out these markers in the display version, which results in outputs similar to the one below.
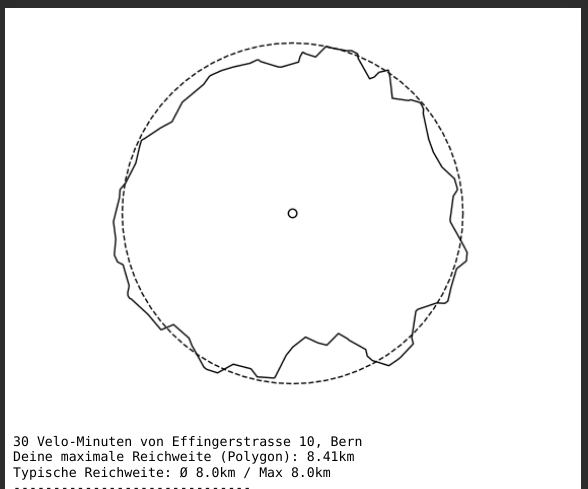
To generate some kind of High Score we then needed to find a way to calculate a maximum distance. A simple method to do so is to use the extend box of the generated geometry to at least cover x and y distances. While a more accurate calculation - possibly based on street kilometers should be done here, this basis was enough for a simple score. While this means any direction off x or y axis will be underrepresented, it nevertheless assures us of comparability.
Trial by fire
After some testing with crowd-sourced addresses and doing small bugfixes it was time to tackle the printer itself. We opted for the wonderful Mini Thermal Receipt Printer Adafruit project, part of the "Internet of Things" package. This required some additional fun hardware and software hacking.
A minimal web application written in Flask allows visitors to enter an address (could be their home, work, or any other point of interest they can think of), from a tablet, mobile phone or other device. A processing job as described above is run to prepare the visualization. The resulting graph is generated and cached in the web application.
When the printer's button is pushed, a Python script connects to the Flask API to retrieve the last cached result, and sends it to the printer. Text and graphics are handled separately, in particular since a bit of cropping of the image using the PIL graphics library is required.
And "Presto!" personalized data in tangible form for a happy fairgrounds visitor - with thanks to our friends from the Fab Lab and Effinger for encouragement, material and build help! And of course, much gratitude goes out to the wider open hardware and open data science communities that were instrumental here.
As noted above, this was a project done very much in the spirit of the hack and spur of the moment. As evidenced in the Git log, plenty of tweaking was done on location at Criterion itself.
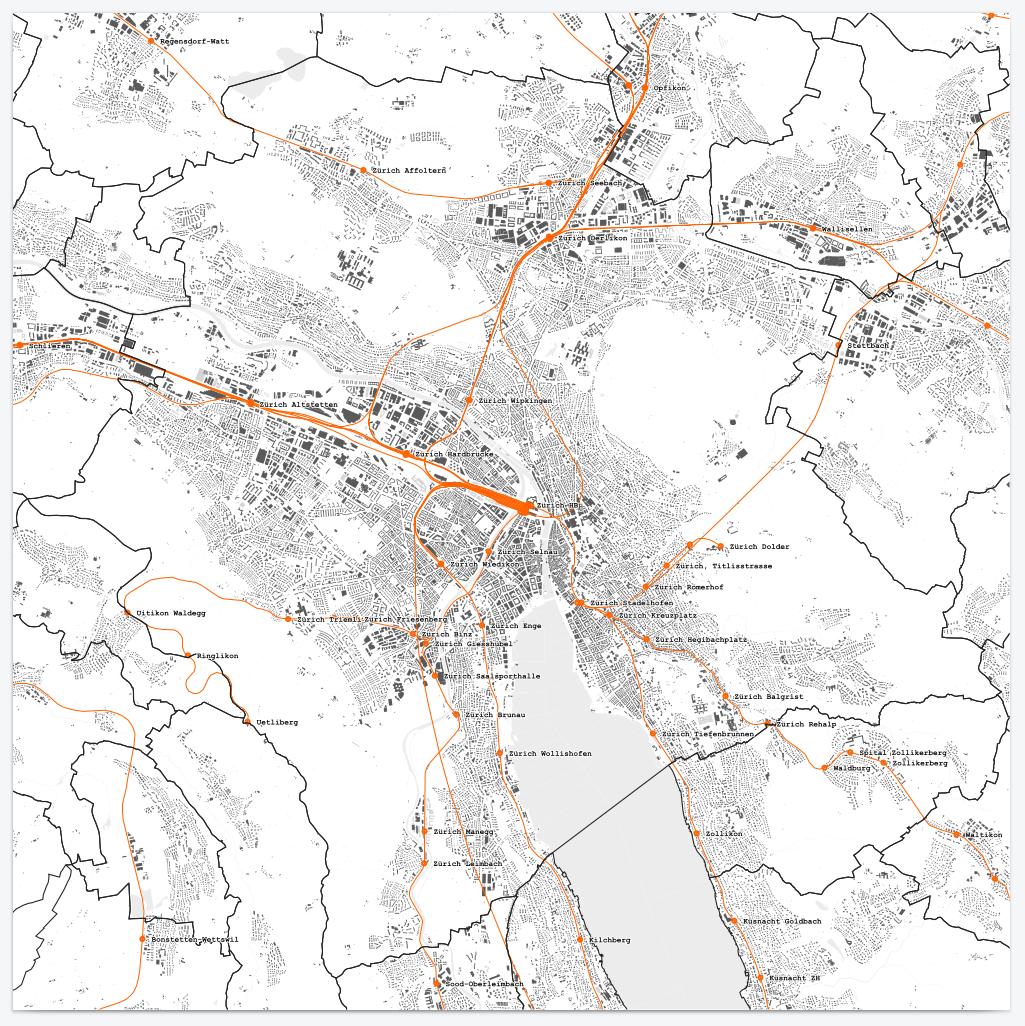
Currently this project does not support multiple simultaneous devices in operation. We have not extensively tested this, invalid addresses and other bugs may break the code. So we also put up this paper summary of Zürich neighbourhoods as a backup in case something borked.
It is at time of writing alpha code and not very safe to run this particular server application on the wide open web. As long as you don't invite too many robots, it is enough for personal use and demo purposes. Consider yourself duly warned & enjoy ;-). The client and server code components of our solution are in an open source repository.
What is "cividi" ? Friend, that will be the topic for another day. Stay hungry.
In the future, everything will be connected to the internet. And all restaurants will be Taco Bell!
Adafruit
